In this guide
- How Strategic Lake Management Leads to Predictable Source Water Quality
- Temperature, Oxygen, and Source Water Quality Problems
- Manganese, Iron, Oxidant Demand, and Membrane Filters
- T&Os: Production, Transport and Persistence
- Cyanobacteria, cyanotoxins, and treatment barriers
- Algae Biomass, Coagulant Demand, and DBP Formation Potential
- Building a source water quality management strategy
- Taste and odor in tropical source waters
- References & resources
01How Strategic Lake Management Leads to Predictable Source Water Quality
A recurring increase in manganese, activated carbon, or coagulant demand often begins in the reservoir before it appears in the plant record. The opportunity is to connect those events early enough to do something useful: prepare a treatment response, adjust an intake, or manage the source. We start by linking the water the plant receives with the conditions that produced it.
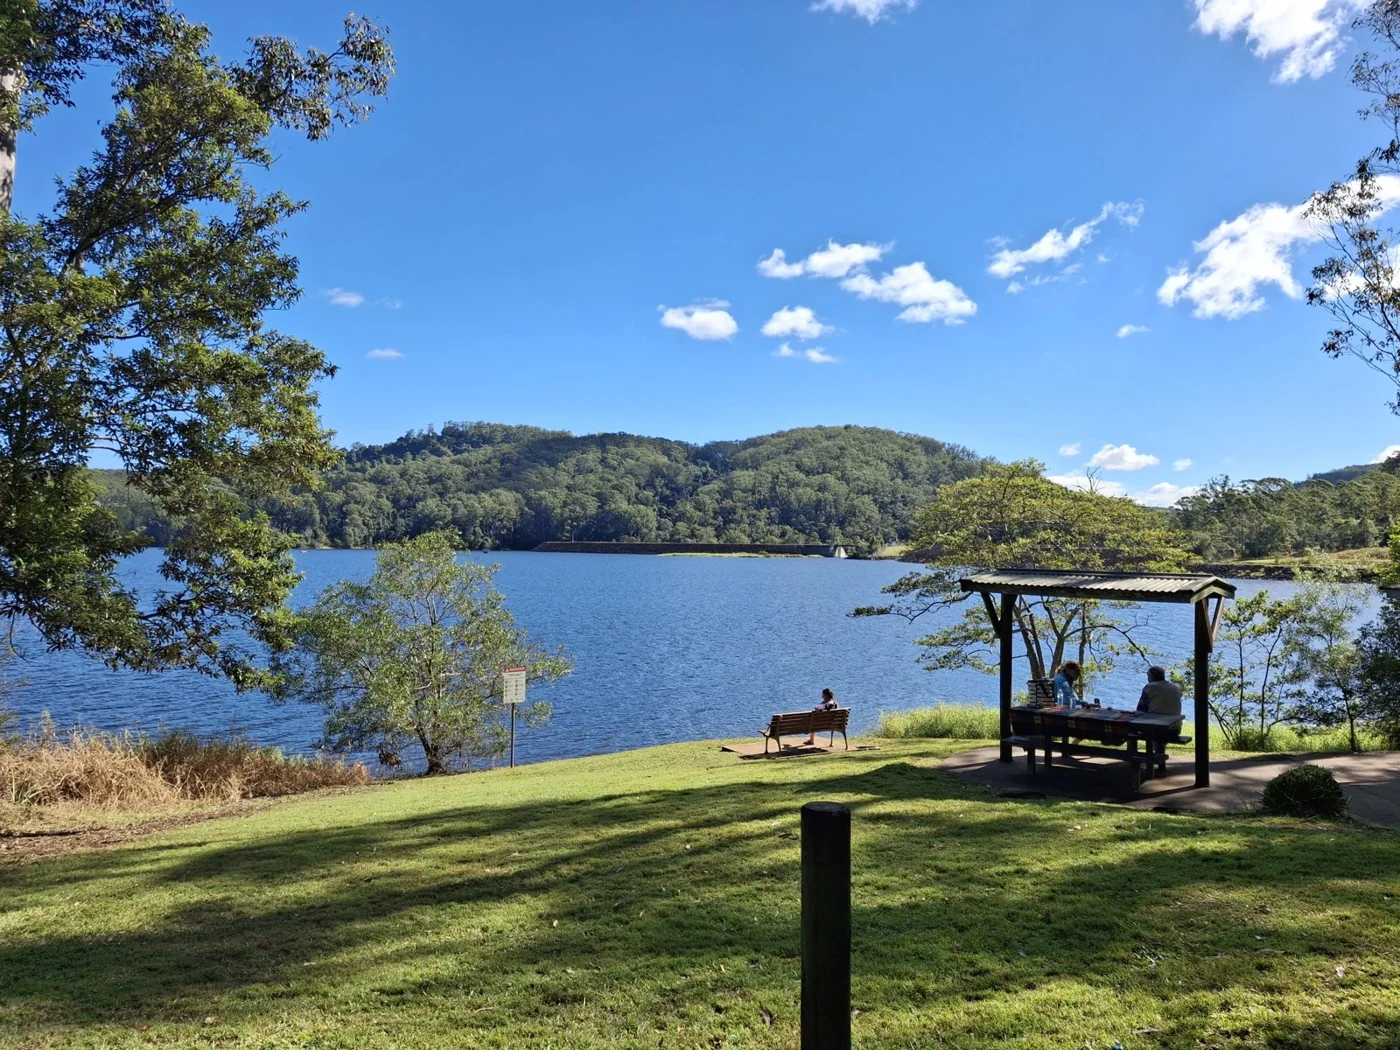
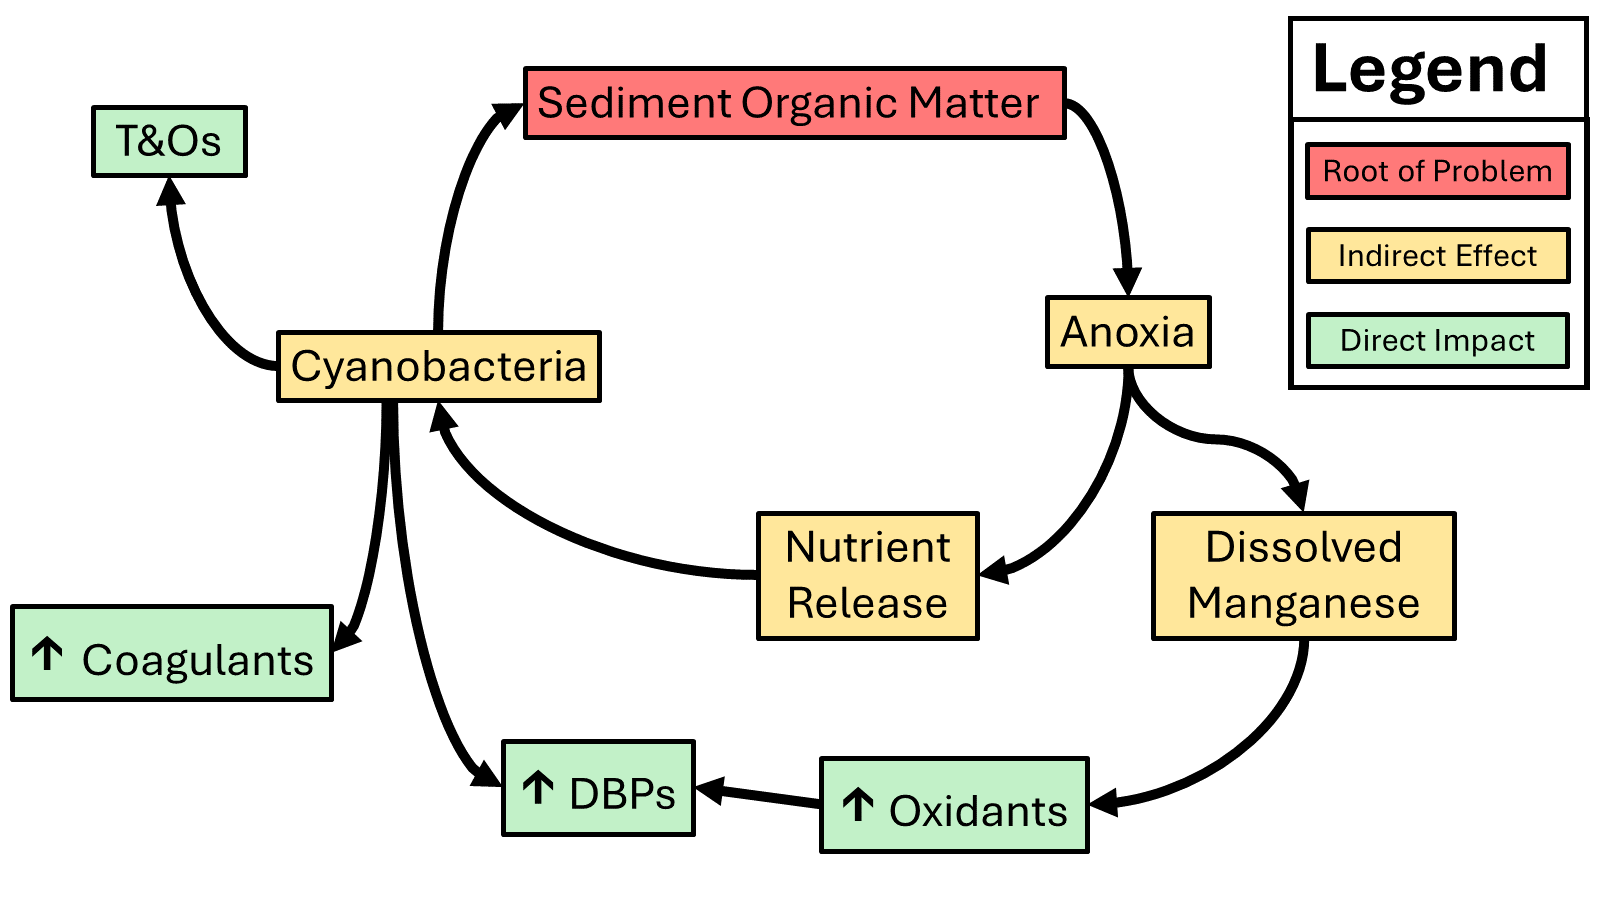
Manganese, taste-and-odor compounds, cyanobacteria, and organic carbon can share contributing conditions without having one universal cause. Stratification and oxygen depletion may promote dissolved metals at depth. Nutrient availability can support biological growth. The organisms, compounds, and transport routes involved still need to be distinguished.
At the plant, these changes can affect oxidant demand, activated carbon use, coagulation, filters, membranes, residuals, and disinfection by-product control. The response depends on the chemical form reaching the intake and the barriers available. Two raw waters with similar total organic carbon or turbidity may have very different treatability.
Several years of chemical use and whatever depth profiles are available can be enough to begin that conversation. We look for whether the first manganese or odor event follows oxygen loss, whether a coagulant increase follows an inflow or a bloom, and how much warning those relationships provide. Plant operating changes belong in the comparison too, because the same raw water can require different treatment under different conditions.
Predictability comes from understanding which process is recurring and what the system can do about it. Reservoir management may reduce the frequency or severity of difficult water while the plant retains its protective barriers. Intake operation may provide a useful interim response while a longer-term source treatment is developed. We assess those parts together rather than treating reservoir and plant budgets as unrelated problems.
Predictability comes from connecting processes
A source-water strategy can link three observations that otherwise sit in separate records: a changing reservoir condition, a constituent approaching the intake, and an operating response at the plant. For example, declining deep-water oxygen provides context for investigating dissolved metals; the metal profile establishes whether the affected water can reach the intake; plant records show the resulting demand on treatment. The connection is stronger than any one trend alone. [1]
For cyanobacteria, the equivalent sequence includes growth conditions, the organisms and toxins actually present, transport to the offtake, and the performance of the available barriers. Earlier warning is useful only when the plant or reservoir team has a feasible response. We develop the science and that operational connection together. [2]
Schedule a call about your recurring source-water challenges →
02Temperature, Oxygen, and Source Water Quality Problems
In a stratified reservoir, warm surface water and denser deep water exchange slowly across a temperature gradient. Oxygen consumed below that gradient may not be replenished quickly enough. The duration and strength of stratification depend on depth, shape, climate, inflows, wind, and withdrawal.
As oxygen is consumed, microbes can use other electron acceptors, including nitrate, manganese oxides, iron oxides, and sulfate. The reactions overlap in real sediment, but the sequence helps explain why manganese can appear before a strong dissolved-iron or sulfide signal. Decomposition also releases ammonium, which can add chlorine demand and influence chloramination at the plant. [1]
A profile tells us where to investigate, and the chemical samples tell us what that water contains. If one intake port has algae, another has elevated odor compounds, and the deepest has manganese, moving deeper isn't automatically an improvement. Comparing the available withdrawal zones against the plant's actual treatment capabilities is more useful than selecting the depth with the clearest-looking water.
The intake receives water from a zone whose depth and extent can change with withdrawal rate and thermal structure. A nominal intake elevation is therefore not the whole exposure assessment. Inflows, wind-driven movement, and seasonal mixing can bring water from elsewhere in the reservoir toward that zone.
Selective withdrawal can be useful where alternative intake depths or sources are available. The tradeoffs may include temperature, algae, dissolved metals, odor compounds, and downstream requirements. Moving away from one problem can increase exposure to another.
Deep water isn't always cold. Warm tropical reservoirs can remain stratified and oxygen-depleted for long periods without a temperate winter reset. Expectations about seasonal recovery, decomposition, and treatment timing need to reflect the local thermal regime.
| Process | Potential water-quality consequence | Why a simple oxygen threshold is insufficient |
|---|---|---|
| Respiration and decomposition | Oxygen consumption and release of nutrients from organic material | Temperature, organic-matter supply and transport affect rates. |
| Reduction of manganese oxides | Accumulation of dissolved Mn(II) | Minerals, microorganisms and local sediment conditions affect release. |
| Reduction of iron phases | Dissolved Fe(II) and possible release of associated phosphate | Phosphorus can be retained by other minerals or transported differently. |
| Sulfate reduction | Sulfide production and competition for reactive iron | Sediment microsites can be reducing beneath oxygenated water. |
| Mixing or changing withdrawal | Stored constituents reach a different depth or the intake | A chemical inventory at depth is different from the concentration reaching treatment. |
This is a process sequence to consider, not a table of universal redox-voltage or dissolved-oxygen cutoffs. [1] [3]
Temperature also changes oxygen solubility, biological demand and reaction rates. A stable thermocline can separate good-looking surface water from difficult source water at depth. A change in mixing can improve oxygen distribution while bringing accumulated metals, nutrients or odor compounds into the withdrawal zone. The direction of the benefit depends on the constituent and the timing.
We use depth profiles, constituent distributions, hydrology, and operating records together to assess intake risk. The objective is enough warning to evaluate a feasible response before the affected water reaches the plant.
03Manganese, Iron, Oxidant Demand, and Membrane Filters
Manganese and iron in source water can originate in the catchment or become mobilized from sediment. Under reducing conditions, dissolved forms can accumulate in deep water. When that water reaches the plant, the consequences depend on concentration, chemical form, organic matter, and the treatment process.
Iron and manganese can respond very differently after oxygen returns. Dissolved iron often oxidizes and forms particles within minutes to hours under oxygenated, near-neutral conditions, while uncatalyzed manganese oxidation can remain slow enough for dissolved manganese to persist for weeks or months. Microorganisms and manganese-oxide surfaces can accelerate manganese removal substantially. Temperature, pH, complexation, and transport determine which behavior the reservoir shows. [1] [4]
A rise in oxidant use can reflect manganese, iron, sulfide, ammonium, or a changing organic mixture. We compare those constituents with the dose and plant conditions because controlling one reservoir source may reduce only part of the demand. That comparison also helps explain why iron can improve after oxygenation while manganese and operating costs respond more slowly.
Where precipitation occurs matters as much as whether oxidation is possible. Forming removable particles ahead of clarification can help; forming deposits on a membrane can increase pressure and cleaning demand. Seasonal changes in backwash frequency, pressure, and oxidant use are therefore useful alongside dissolved and total metal results when we investigate a reservoir-to-plant problem.
Reservoir oxygenation may reduce continued mobilization where oxygen delivery and sediment chemistry are suitable. Existing dissolved manganese can still require time or additional treatment to be removed. Intake management, source blending, and plant-side barriers may be needed during that transition.[4]
| Form reaching the plant | Treatment implication | Useful distinction |
|---|---|---|
| Dissolved Fe(II) or Mn(II) | Requires conversion, adsorption or another effective dissolved-constituent barrier. | A membrane that removes particles does not necessarily remove dissolved ions. |
| Oxidized metal particles | Can be removed by suitable clarification and filtration. | Particle formation must occur where the process can capture and handle the solids. |
| Organically associated metal | May respond differently to oxidation and separation. | Total metal concentration alone does not describe its treatability. |
| Mixed reduced constituents | Iron, manganese, sulfide and other substances compete for oxidant. | Dose changes should be interpreted against the mixture and the process objective. |
Metal chemistry and oxidation kinetics are discussed in Davison; plant implications depend on the actual equipment and operating conditions. [1]
For microfiltration and ultrafiltration, the distinction between dissolved metals and particles is especially important. Dissolved ions may pass through, while precipitation on or within a membrane can contribute to fouling, pressure changes and cleaning demand. Nanofiltration and reverse osmosis operate differently, but their rejection, pretreatment needs and concentrate management are system-specific. “Membrane filtration” is therefore too broad a description to predict the metal response.[5]
The federal secondary drinking-water values provide useful aesthetic context: manganese is 0.05 mg/L and iron is 0.3 mg/L. They are non-enforceable federal secondary standards; states may adopt enforceable provisions. These values don't replace a utility's applicable requirements, health assessment or process-specific operating targets. [6]
ENV evaluates the source, transport, and treatment response together. That helps distinguish inadequate oxygen distribution, persistent dissolved manganese, a new inflow source, and a plant-process limitation before selecting the next intervention.
EPA's 2004 manganese assessment also gives a nonregulatory lifetime drinking-water health advisory of 0.3 mg/L, distinct from the 0.05 mg/L secondary aesthetic value. The assessment applies the 0.3 mg/L value to short-term exposure for infants younger than six months as well. The applicable state requirements and the utility's response framework still govern the operating decision; the aesthetic value isn't a complete health assessment. [12]
Discuss metal results, oxidant use, and filter performance →
04T&Os: Production, Transport and Persistence
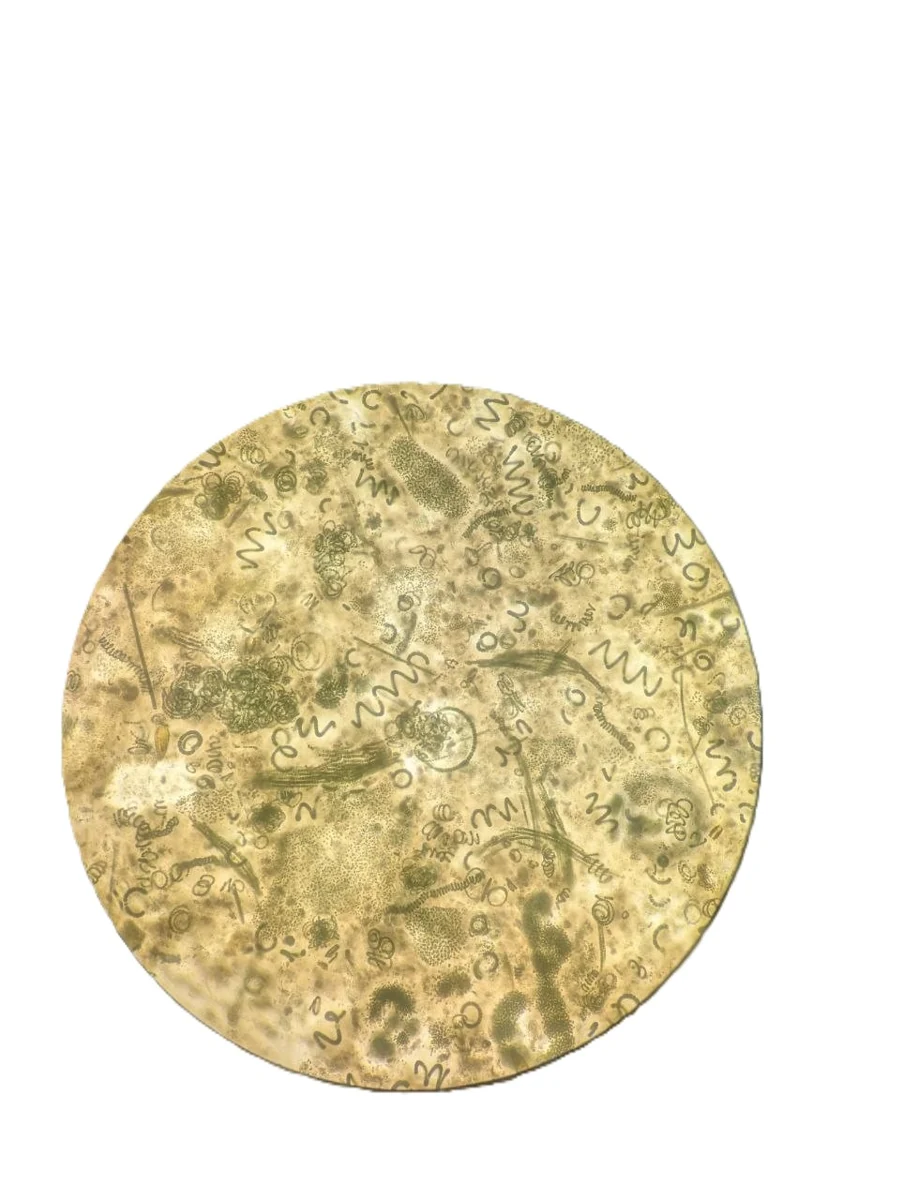
An earthy or musty odor can persist after the visible bloom has disappeared because the compound and the organism have different histories. Geosmin and 2-methylisoborneol (MIB) are produced by particular microorganisms, and concentrations of only a few nanograms per liter can matter to customers. We distinguish who produced the compound, where it has accumulated, and how it reaches the intake before choosing a response.
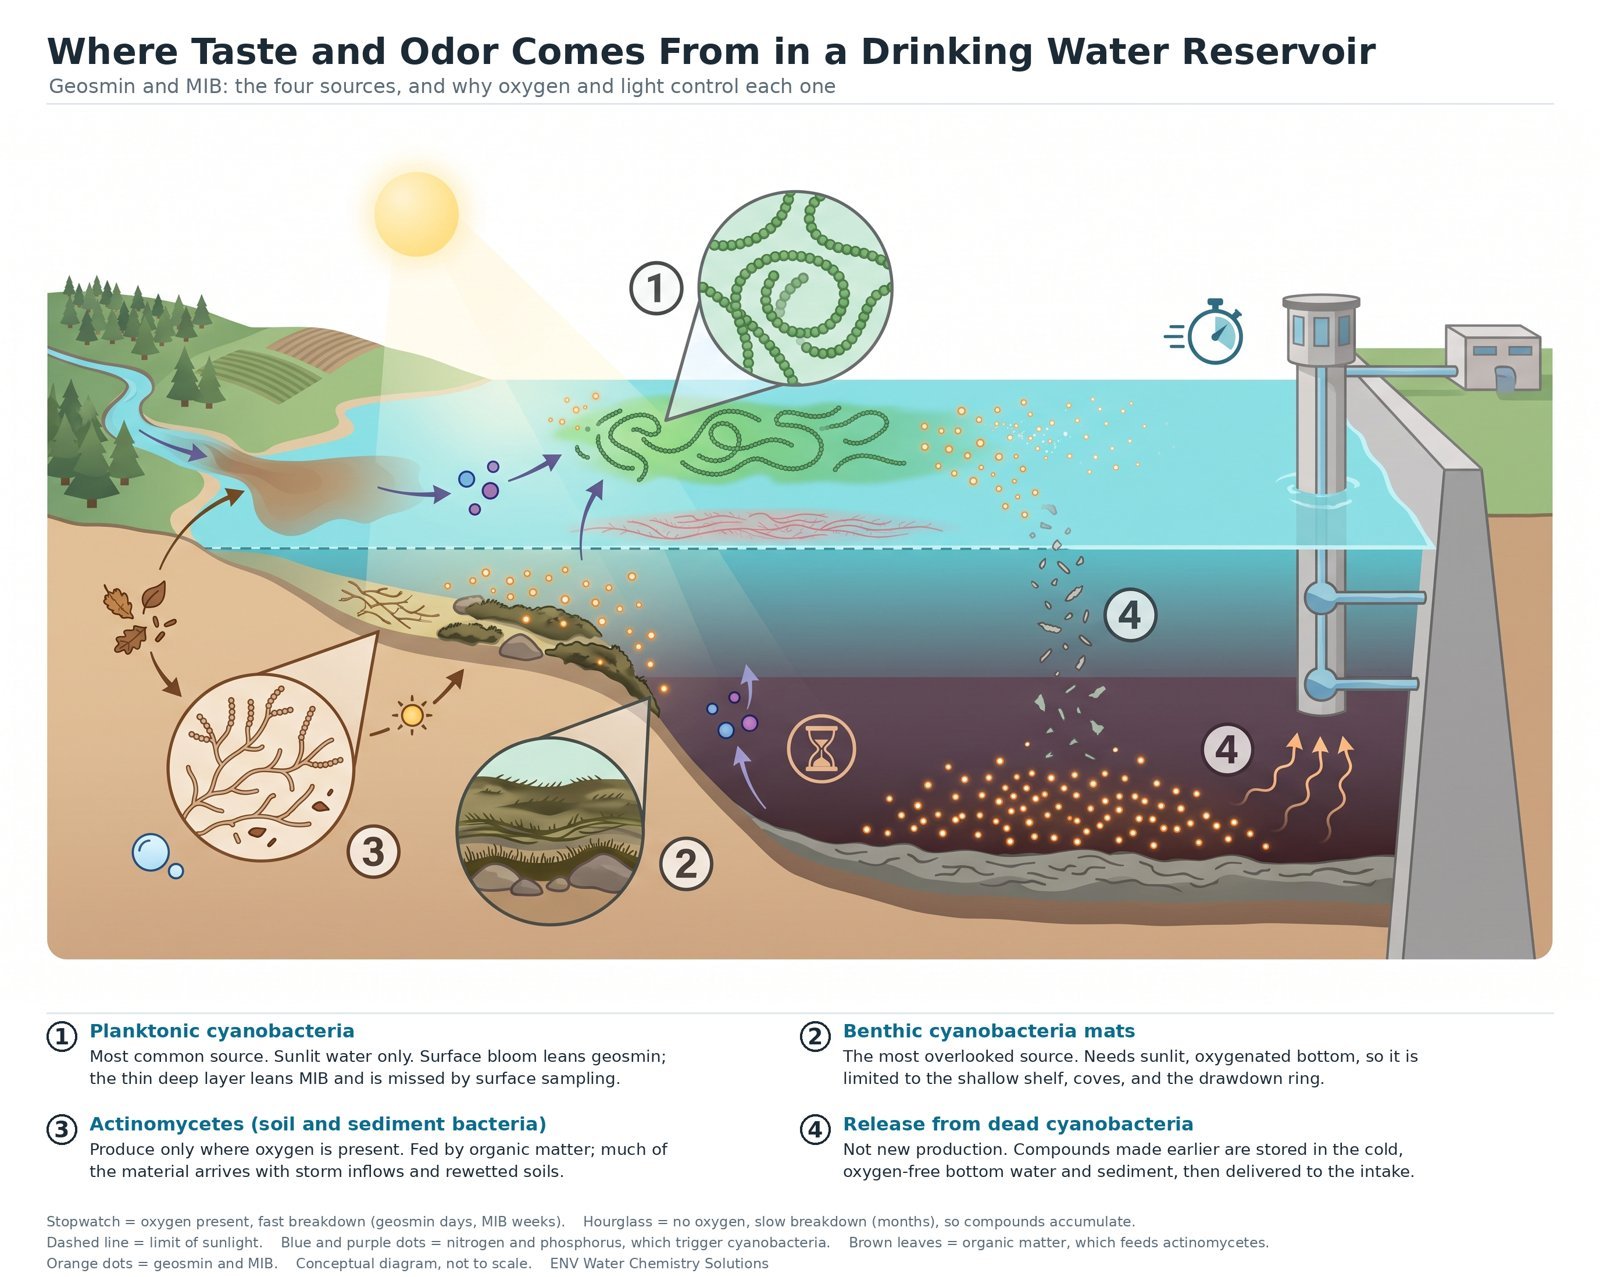
The location of an odor compound isn't necessarily the location where it was produced. Compounds can be released from living or degrading biomass, transported with water, and persist after the original population has declined. A high concentration in oxygen-depleted bottom water can therefore reflect accumulation of previously produced material rather than active production at that depth.
Four source patterns worth distinguishing
Open-water cyanobacteria can produce compounds within the illuminated water column. Production varies by species and strain, and some populations occupy deeper illuminated layers rather than the surface. Chlorophyll alone doesn't identify an odor-producing population.
Benthic mats can occur on illuminated sediment, plants, or other surfaces. Shallow shelves, coves, and changing shoreline zones can matter even where open-water samples show relatively little biomass. A deep central station can miss these sources.
Soil-associated and sediment-associated microorganisms, including actinomycetes, can contribute geosmin or MIB. Inflow events, organic material, and changing shoreline conditions may influence delivery. Their importance should be established from site evidence rather than assumed from the presence of soil.
Settling biomass can deliver compounds produced in illuminated water into a deeper layer where they persist after the producing population declines. Biodegradation becomes faster when an effective microbial community and suitable conditions are present; experiments with geosmin show a clear temperature and seasonal effect. Cold, oxygen-depleted storage can prolong an event, while even warm tropical bottom water can accumulate compounds when oxygen and microbial processing are limiting. That makes a later intake event potentially a transport problem from earlier production. [7] [13]
This distinction affects the response. Managing an active shoreline source is different from reducing open-water growth or dealing with a deep accumulation approaching an intake. Oxygenation may influence decomposition and persistence without removing an ongoing biological source.
Geosmin and MIB react too slowly with chlorine and chloramine for ordinary disinfection to provide reliable removal. Their low reactivity explains why increasing a routine chlorine dose may add cost without solving the odor. Activated carbon, ozone or advanced oxidation, and biologically active treatment offer different removal pathways, with performance affected by contact conditions and competition from the rest of the organic matter. [7]
We combine compound measurements with depth profiles, microscopy where relevant, shoreline observations, inflow information, and plant response. The objective is to identify whether the important control is production, delivery, persistence, or a combination.
| Process | Why it matters at the intake |
|---|---|
| Production in plankton | A producer can grow in the water column, but producer abundance and compound concentration need not peak together. |
| Production in benthic or attached communities | A surface-water sample can miss organisms growing on sediment, plants or other surfaces. |
| Release from cells and settling material | Dissolved odor compounds can remain after a visible population declines or moves. |
| Transport between depths | Inflow, mixing and withdrawal can expose the intake to compounds produced elsewhere. |
| Biodegradation and other losses | Persistence varies with environmental conditions and the microbial community; there is no universal lake half-life. |
Geosmin and MIB have multiple microbial sources. Their presence is an odor finding, not a cyanotoxin test. [7]
Human odor detection can occur at concentrations on the order of a few to roughly ten nanograms per liter, depending on the compound, water and assessor. One microgram per liter is 1,000 nanograms per liter, which explains why a concentration that looks numerically small can still be operationally important. Odor analysis therefore has different reporting requirements from many routine water-quality tests. [7]
The chemical identity also matters. Geosmin and MIB aren't removed reliably just because intact cells are removed, and their persistence isn't described by the same chemistry as dissolved manganese. Reservoir prevention, intake selection, adsorption and biologically active treatment address different parts of that problem.
Paired whole-water and filtered odor results can be particularly informative. A large difference points toward cell- or particle-associated material, while a rising dissolved fraction changes what the treatment barriers need to remove. Filtration alone doesn't prove the compound was intracellular, and sample handling can damage cells, so we interpret the split with microscopy, depth, and treatment history. If those results are already in your record, they can help focus a discussion of production versus persistence.
| Observation | Possible explanation | What it does not prove |
|---|---|---|
| Odor with an open-water bloom | Production by a component of the community | That all cells produce odor compounds or toxins |
| Odor near shallow margins | Benthic growth, decaying material, or inflow transport | A unique source without further evidence |
| Increasing concentration at depth | Settling, release, transport, and persistence | Active production in dark bottom water |
| Odor after a bloom declines | Residual dissolved compounds or decomposing biomass | That the source has stopped or that the water is toxin-free |
05Cyanobacteria, cyanotoxins, and treatment barriers
A cyanobacterial identification tells us which toxin questions to investigate, not how much toxin is present. Some strains produce toxins and others don't, and the concentration can change independently of the visible biomass. We connect organism identification with chemical testing and the exposure at the intake so that the response addresses what the plant is actually receiving.
The distribution between cells and water also matters. Some toxins can be substantially associated with intact cells, while others may have an important dissolved fraction. Species, toxin family, growth conditions, and cell damage affect that distribution. A treatment designed to remove intact cells may provide less protection against dissolved compounds.
Coagulation, clarification, and filtration can remove cells when appropriately operated. Oxidation or algaecide application that damages cells before effective removal can increase the dissolved fraction. This doesn't mean all oxidation is inappropriate; it means cell removal and toxin destruction must be considered together.
Toxin families respond differently to treatment. EPA guidance identifies chlorine as capable of treating cylindrospermopsin and microcystins under suitable conditions. Anatoxin-a is more resistant to conventional chlorination. Effectiveness depends on pH, oxidant exposure, competing demand, and the process. A strategy validated for one toxin shouldn't be assumed effective for another. See EPA's drinking-water cyanotoxin treatment guidance.
The response follows the toxin and form present, the applicable requirements, and the barriers the plant can verify. A decline in chlorophyll may mean fewer cells while dissolved toxin remains a concern. That's why reservoir observations and raw- and finished-water testing need to inform the same operating conversation.
| Toxin | Bottle-fed infants and preschool-age children | School-age children and adults |
|---|---|---|
| Microcystins | 0.3 µg/L | 1.6 µg/L |
| Cylindrospermopsin | 0.7 µg/L | 3.0 µg/L |
These 2015 values are nonregulatory federal Health Advisories for drinking water, not enforceable federal maximum contaminant levels, raw-water treatment targets or recreational thresholds. Applicable state requirements and response plans must also be considered. [8]
| Barrier | Intact cells | Dissolved toxins |
|---|---|---|
| Coagulation, clarification and filtration | Can remove cells when the process is effective and cells remain intact. | Cell removal alone does not establish dissolved-toxin removal. |
| Activated carbon | Not the main purpose of this barrier. | Performance depends on toxin, carbon properties, contact and competing organic matter. |
| Free chlorine | Pre-oxidation can damage cells and release contents. | Can treat microcystins and cylindrospermopsin under suitable conditions; not broadly effective for anatoxin-a. |
| Microfiltration / ultrafiltration | Can provide cell removal with suitable membrane integrity. | Should not be assumed to remove dissolved toxins. |
| Nanofiltration / reverse osmosis | Provide a different separation barrier. | Rejection is toxin- and membrane-dependent and requires process verification. |
Summary of EPA treatment guidance. Effectiveness depends on the toxin, water chemistry, exposure and the performance of the treatment train. [9]
Analyzing both raw and finished water can answer different questions. Raw-water results describe the challenge presented to treatment; finished-water results address the water supplied. Sample preparation also matters: a dissolved-toxin result and a result that includes toxin released from cells aren't interchangeable. The analytical method and the management response should use the same definition. [2]
ENV can help connect reservoir risk, sampling, early warning, and source-control options with the plant's treatment capabilities. The objective is an integrated response that accounts for what each barrier can actually remove or destroy.
Discuss source investigation and coordination with your response team →
06Algae Biomass, Coagulant Demand, and DBP Formation Potential
Two waters with similar organic carbon can behave differently in the plant. A storm can bring aromatic watershed material that responds well to enhanced coagulation; a bloom can add cells and dissolved compounds with a different removal response. We want to understand that change in character, not just whether total organic carbon increased.
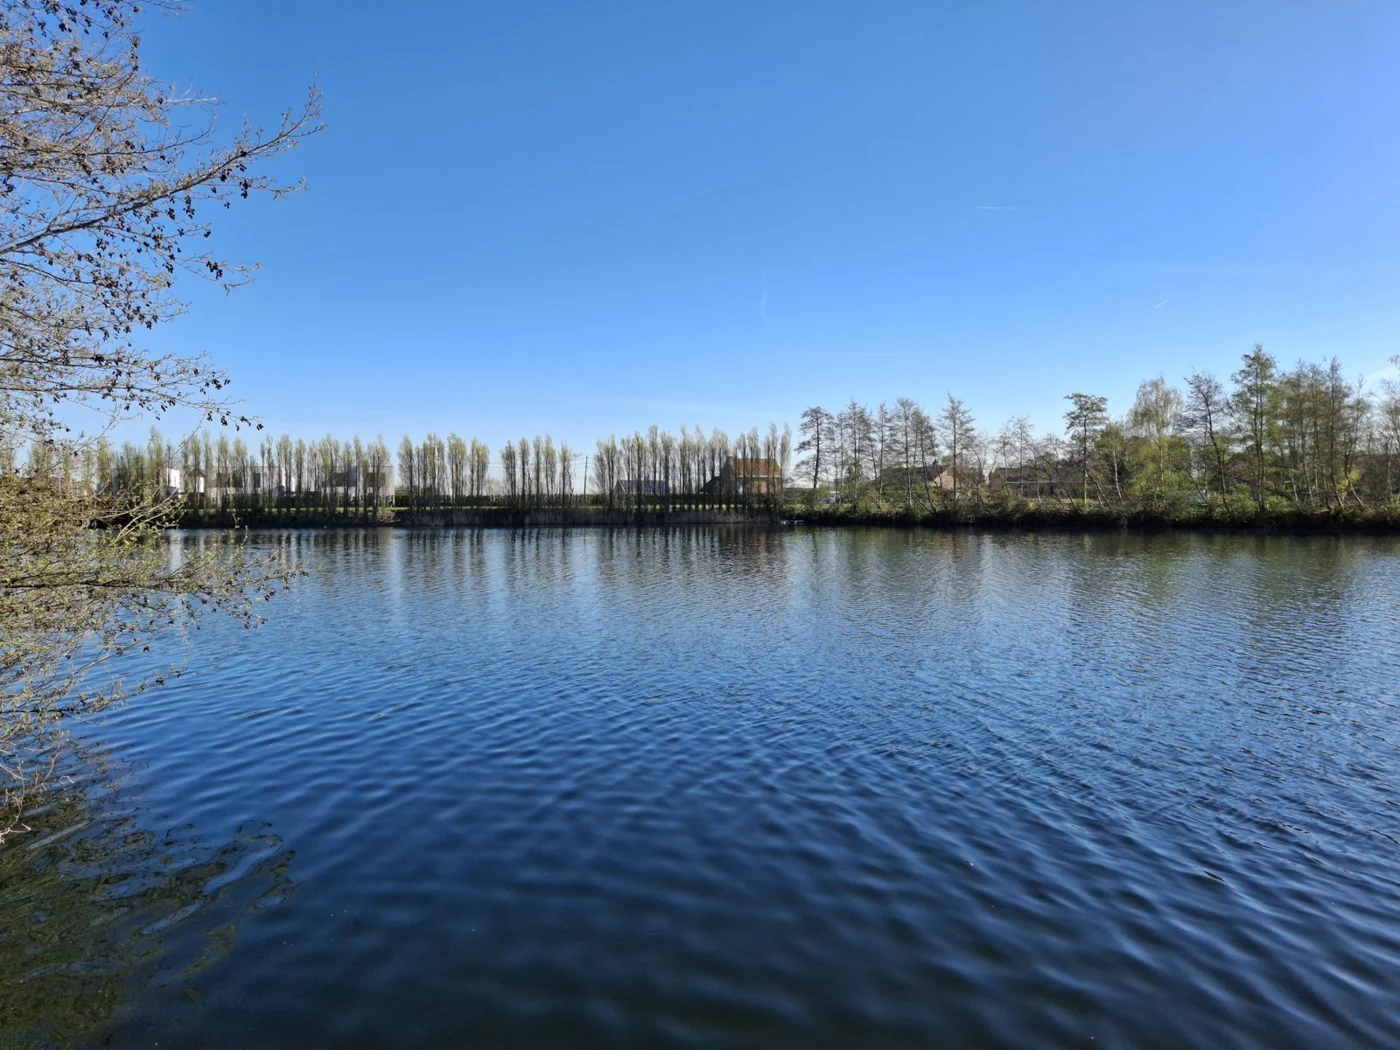
Total organic carbon measures quantity, not the full character of the material. Waters with similar TOC can differ in coagulation response, activated-carbon competition, oxidant demand, and disinfection by-product formation. Changes in the organic mixture can therefore matter even when the total concentration changes little.
Some dissolved algal material responds poorly to conventional coagulation, while other components and intact cells can be removed effectively. Increasing the dose may therefore reach diminishing returns without making the process useless. The response depends on molecular composition, pH, the coagulant, and the rest of the water chemistry.
Specific ultraviolet absorbance (SUVA) relates UV254 absorbance to dissolved organic carbon. Values below about 2 L/(mg·m) generally indicate lower-aromaticity, largely non-humic material with poorer coagulation removal; values above about 4 generally indicate more humic material that responds better, with mixtures between them. SUVA describes character rather than uniquely identifying a source, so we read it alongside bloom timing, inflows, and treatment response. [10]
DBP formation depends on the precursor mixture, disinfectant, bromide and other water chemistry, and treatment and distribution conditions. Bulk carbon measurements alone can't predict all by-products. Site-specific formation-potential or process testing can help distinguish a meaningful precursor change from a change in total carbon.
Reducing nutrient-supported biomass may reduce part of the organic load, but the effect on plant costs must be measured. Terrestrial inputs may remain important, and changes in algal community or dissolved fractions can alter treatability. A reduction in chlorophyll isn't a fixed conversion to coagulant or carbon savings.
| Measurement or property | What it helps explain | What it does not establish |
|---|---|---|
| TOC and DOC | Total organic carbon and the operationally dissolved fraction | Which compounds dominate or how readily they will be removed |
| UV absorbance at 254 nm | Absorbing organic constituents, often associated with aromatic character | A complete measure of all organic matter |
| Specific UV absorbance (SUVA) | UV absorbance normalized to DOC; commonly reported in L/(mg·m) | A unique fingerprint of algae versus watershed sources |
| Cellular and extracellular algal material | Particles, proteins, polysaccharides and other compounds with different treatment behavior | One universal coagulant response for all algae or seasons |
| DBP formation potential | Formation under the conditions of the selected test | The concentration that will occur throughout a real distribution system |
Higher-SUVA organic matter is often more amenable to conventional enhanced coagulation than low-SUVA hydrophilic material, but the response needs testing in the actual water. Low SUVA doesn't mean removal is impossible. [10]
Algal organic matter can include material released by living cells and material released during cell damage or decay. Two samples with the same DOC can therefore differ in coagulant demand, filter behavior and reaction with disinfectants. Formation of disinfection by-products also depends on disinfectant exposure, pH, temperature, bromide and the time spent in treatment and distribution. A reservoir program can reduce part of the precursor burden without replacing plant and distribution-system control.
We assess the source contribution alongside the treatment response. That provides a stronger basis for deciding whether the next improvement should focus on nutrient sources, biomass, intake management, coagulation, adsorption, or another plant process.
A coagulant increase that follows UV254 suggests a different treatability question from a dose increase with little absorbance change during a bloom. Neither pattern identifies the cause alone: turbidity, production, pH, and operational changes also affect the dose. Reviewing those records together can show whether the next useful step is process testing, intake adjustment, or reducing the biomass supplying the difficult carbon. [10]
Enhanced coagulation under the Stage 1 Disinfectants and Disinfection Byproducts Rule addresses removal of organic precursors using requirements and alternatives tied to source-water conditions. Bromide and disinfectant exposure can change the by-products formed even when carbon removal improves. A reservoir intervention can reduce part of the precursor burden, but its effect needs to be connected to treatment and distribution-system results. [10]
Review your carbon measurements and seasonal treatment demand →
07Building a source water quality management strategy
A source-water strategy connects the response available today with the source control worth developing for the next season. Changing a withdrawal depth can reduce immediate exposure without changing production. Oxygenation may change metal release or deep-water conditions, while nutrient control aims to reduce the biomass supplying future treatment challenges. Each measure should have a defined job and a way to verify it.
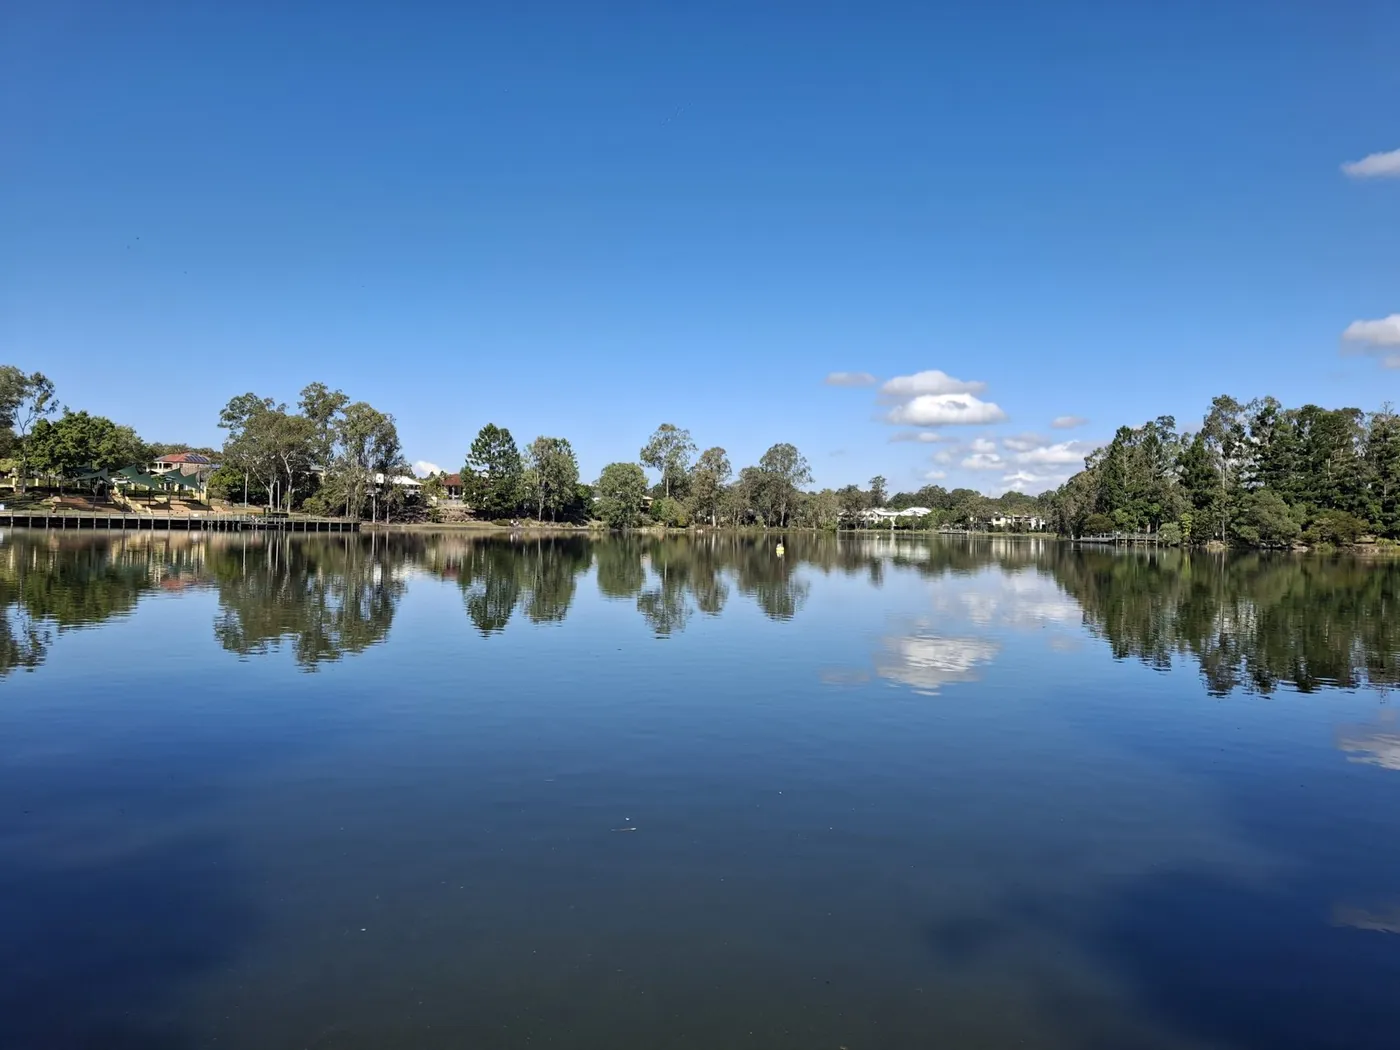
Sediment phosphorus control can be relevant where internal loading supports nuisance growth. Aluminum or lanthanum-based binders add chemical retention capacity; oxygenation can support native iron binding where the sediment chemistry is suitable. The important evidence includes the releasable phosphorus pool (mainly the iron-bound and organic fractions, not total sediment phosphorus), release conditions, competing inputs, and ecological constraints.
Whole-column mixing deserves particular attention when odor compounds or dissolved metals are already stored at depth. It can transport that water toward an intake while improving oxygen elsewhere. Hypolimnetic oxygenation aims to add oxygen while preserving useful stratification, but the existing constituent pool still needs time, transport, and suitable reactions to decline. We assess the startup transition as well as the intended longer-term benefit. [11]
Watershed controls can reduce new nutrient or organic inputs. Biological and shoreline management may address localized production. Plant-side changes can improve barriers where source control is incomplete or too slow. The appropriate combination depends on which part of the problem each measure can influence.
A proactive plan identifies seasonal and event risks, monitoring responsibilities, confirmation requirements, feasible responses, and how effectiveness will be judged. It includes the organizations with authority to operate the reservoir, modify intakes, apply treatments, and manage the plant. Forecasts are useful when that response structure is in place.
| Location of intervention | What it can change | Evidence of success |
|---|---|---|
| Catchment and inflows | The amount, form and timing of new nutrients, particles or organic matter | Delivered loads and the reservoir response under relevant flow conditions |
| Reservoir nutrient management | The supply supporting nuisance growth and organic deposition | Targeted phosphorus forms, biological response and persistence through the problem season |
| Reservoir oxygenation | Oxygen exposure and some redox-sensitive constituent release | Distribution, temperature, dissolved constituents and sustained operating demand |
| Intake selection or blending | The mixture of water presented to treatment | Constituent concentrations and actual plant performance after the change |
| Treatment plant barriers | Cells, particles, dissolved constituents or precursors within the process capability | Validated barrier performance, finished-water quality and operating reliability |
Several measures can be useful simultaneously, but their benefits shouldn't be double-counted. [2] [11] [10]
The resulting strategy should identify the dominant source-water problems, the warning available, the interventions the organization can actually operate, and the remaining role of each plant barrier. ENV can connect the reservoir assessment with operating records, compare feasible options and define how their performance will be checked. That produces a practical program for the water the plant receives throughout the year.
| Intervention | What it can change | What still needs management |
|---|---|---|
| Withdrawal depth or source blending | Exposure of the intake to a particular water mass | Production and stored material elsewhere in the reservoir |
| Algaecide treatment | A susceptible existing population | Released cell contents, oxygen demand, and renewed growth |
| Aeration or destratification | Oxygen distribution and thermal structure | Movement of stored nutrients, metals, and odor compounds |
| Hypolimnetic oxygenation | Deep-water oxygen and redox-sensitive release | Existing dissolved constituents, demand, and sources outside the treated zone |
| Water-column phosphorus treatment | Phosphorus currently accessible in the water | Continuing sediment release and inflow loads |
| Sediment phosphorus treatment | Release from the sediment area and pool contacted | New inputs, untreated areas, and biological response time |
We sell no chemicals and no equipment; the recommendation is the product. Reservoir chemistry, intake options, and plant operating records let us compare approaches around the water the utility needs to treat, while keeping the required barriers and operational responsibilities explicit.
Case studyTaste and odor in tropical source waters
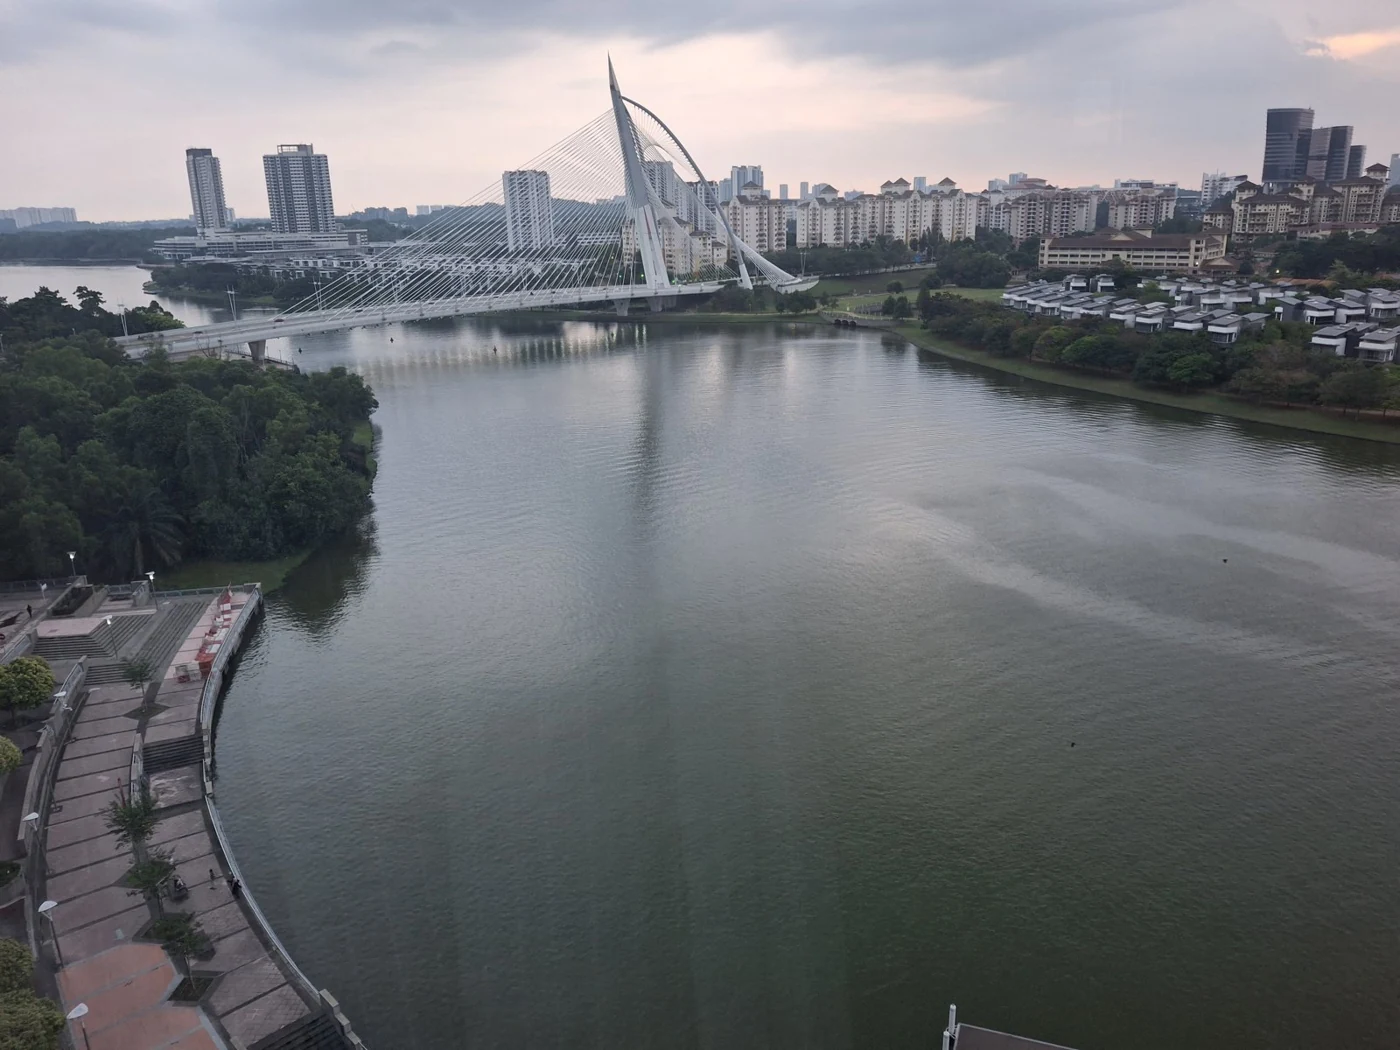
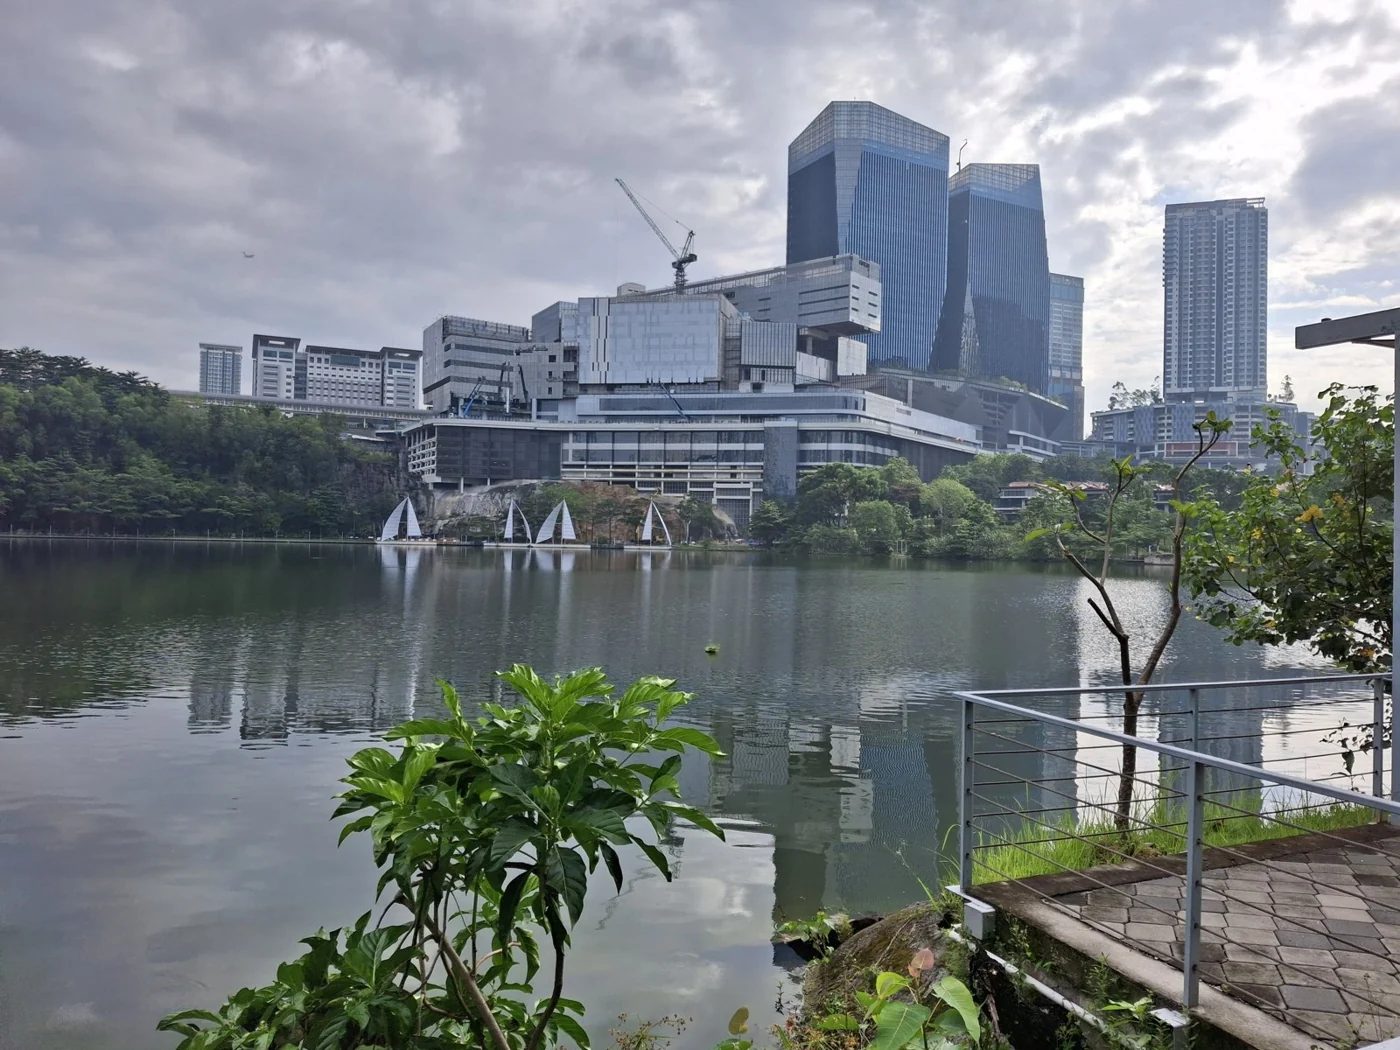
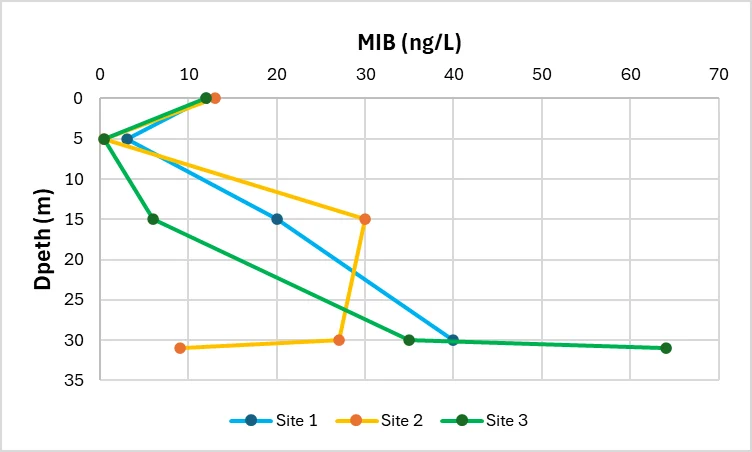
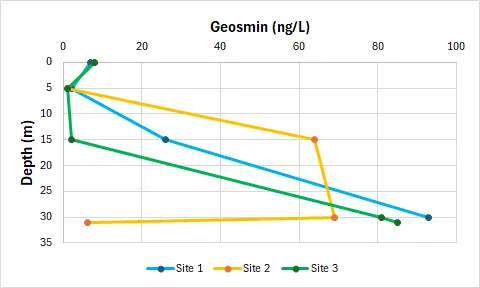
A Malaysian drinking-water reservoir developed in a former mining and quarry setting had steep margins and limited shallow habitat. Geosmin and MIB accumulated in deep water while concentrations in parts of the upper water column were much lower. The reservoir's bottom water remained warm and oxygen-depleted rather than receiving a seasonal winter recovery.
The investigation separated the location of accumulation from the likely location of production. Biological observations and laboratory work supported an explanation involving material produced higher in the water column, subsequent settling, and release or persistence at depth. The interpretation did not require active cyanobacterial growth in dark bottom water.
Oxygenation was evaluated as a possible way to influence degradation and deep-water conditions. That component was preliminary modeling, not a demonstrated field-treatment outcome. It remained necessary to assess ongoing production, transport, oxygen demand, and the likely effect at the intake.
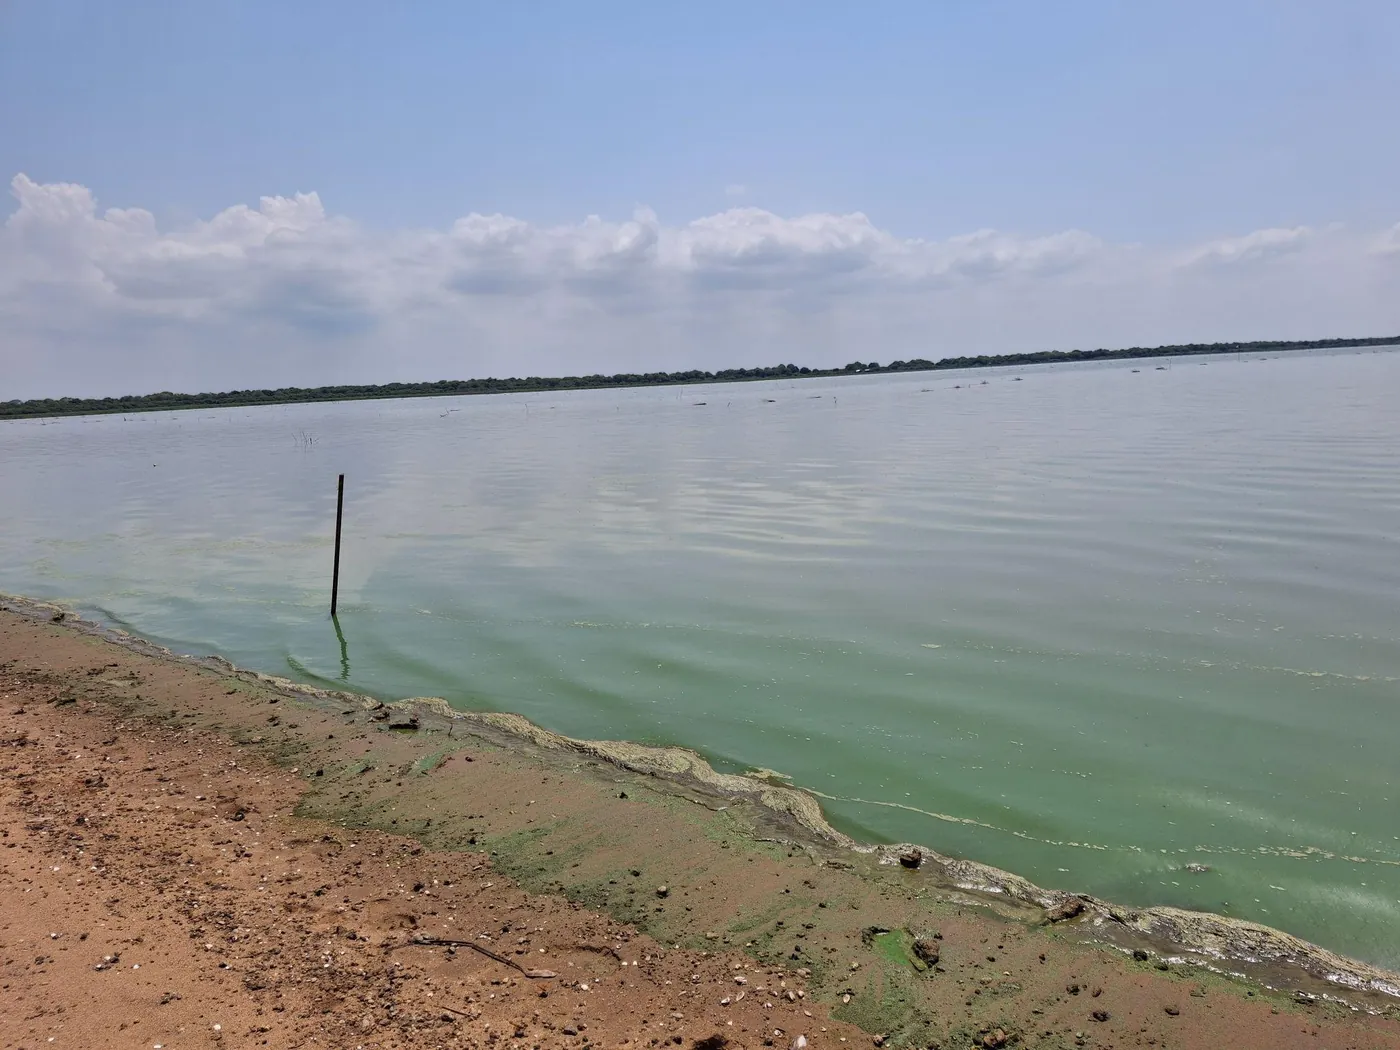
A separate source-water investigation on Cambodia's Tonle Sap encountered strong taste-and-odor conditions as seasonal hydraulic residence time increased. Slower water replacement changed the opportunity for biological growth and compound accumulation. The case illustrates why hydrology belongs alongside biology and chemistry in a source assessment.
These anonymized investigations are described in Byran Fuhrmann's CALMS article on taste and odor in tropical waters. Their common lesson is that a surface sample, a depth maximum, and a plant complaint each describe a different part of the process. Effective source control depends on connecting them.
References & resources
Research and technical guidance supporting this guide. Advisory and regulatory information checked September 2026; local requirements may differ.
- Davison (1993). Iron and manganese in lakes. ↩
- U.S. EPA (2015). Recommendations for Public Water Systems to Manage Cyanotoxins in Drinking Water. ↩
- Hupfer & Lewandowski (2008). Oxygen controls the phosphorus release from lake sediments: a long-lasting paradigm in limnology. ↩
- Bryant, Hsu-Kim, Gantzer & Little (2011). Solving the problem at the source: Controlling Mn release at the sediment-water interface via hypolimnetic oxygenation. ↩
- U.S. EPA (2005). Membrane Filtration Guidance Manual. ↩
- U.S. EPA (current guidance). Secondary Drinking Water Standards: Guidance for Nuisance Chemicals. ↩
- Jüttner & Watson (2007). Biochemical and ecological control of geosmin and 2-methylisoborneol in source waters. ↩
- U.S. EPA (2015). Additional Information about Cyanotoxins in Drinking Water: 2015 Health Advisories. ↩
- U.S. EPA (current guidance). Summary of Cyanotoxins Treatment in Drinking Water. ↩
- U.S. EPA (1999). Enhanced Coagulation and Enhanced Precipitative Softening Guidance Manual. ↩
- Singleton & Little (2006). Designing hypolimnetic aeration and oxygenation systems: A review. ↩
- U.S. EPA (2004). Drinking Water Health Advisory for Manganese. ↩
- Ho, Tang, Monis & Hoefel (2012). Biodegradation of multiple cyanobacterial metabolites in drinking water supplies. ↩
Let's talk about your source water data
We can investigate a source-water problem, evaluate reservoir and plant-side options, or build a coordinated monitoring and management strategy.
A conversation can start with what you've observed. Reservoir profiles and plant operating records can help us connect changes at the intake with chemical use, filtration, and recurring water-quality problems.
Schedule a conversation